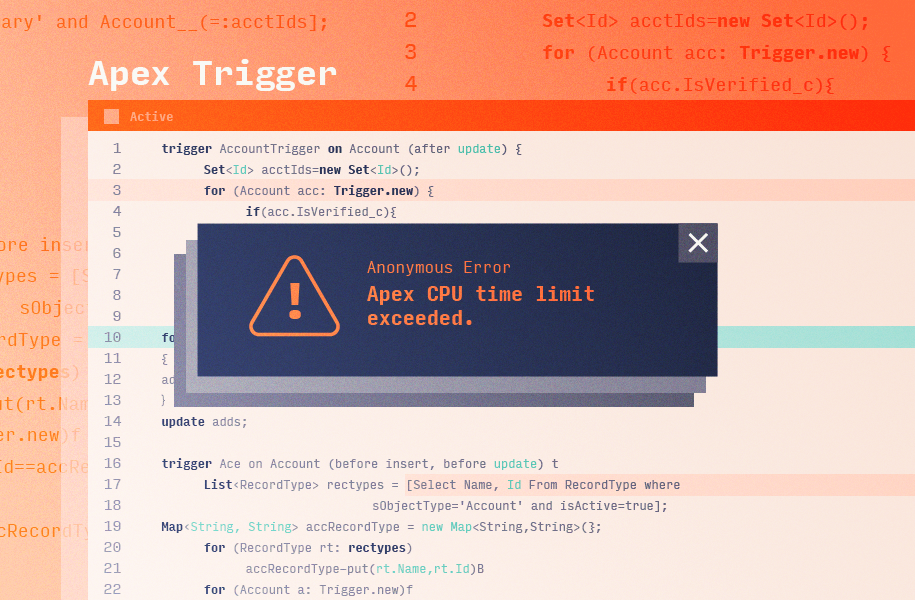
You’re in deep running a Salesforce process when the “Apex CPU Time Limit Exceeded” error message appears.
In an instant, your entire process halts, your completed work rolls back, and you’re left wondering what happened. This isn’t just a minor inconvenience — it’s a red flag signaling a larger performance problem in your Salesforce environment that demands immediate attention.
What is Apex CPU Time Limit Exceeded?
The “Apex CPU time limit exceeded” error message signals that something in your org is consuming more resources than Salesforce’s CPU usage governor limits allow.
These CPU limits enforce fair resource distribution across Salesforce’s multi-tenant environment, preventing any single process from monopolizing system performance.
When your transaction exceeds the CPU time limit — 10 seconds for synchronous processes and 60 seconds for asynchronous ones — Salesforce halts the execution immediately and rolls back any changes, leaving the operation incomplete.
But don’t be fooled by the name — these limits aren’t just about APEX code.
The CPU time limit also applies to all processes within a transaction, including declarative tools like Flows and package code from certified managed packages.
While most certified managed packages get their own limits for certain processes, they still share this CPU time limit for code execution within a transaction.
But not every process contributes to this limit.
Database operations such as Data Manipulation Language (DML), Salesforce Object Query Language (SOQL), Salesforce Object Search Language (SOSL), and waiting time for APEX callouts are excluded from the CPU time calculation.
What Causes Apex CPU Time Limit Exceeded Errors? 5 Common Reasons
Salesforce’s “Apex CPU time limit exceeded” error occurs when a transaction consumes more CPU resources than allowed.
To break it down, here are five common causes that frequently push your transactions over the limit:
1. Processing too many records at once

Handling a large number of records in a single transaction can easily exceed Salesforce’s CPU limit. When you try to update hundreds or thousands of records at once, the CPU time required for each record adds up quickly, pushing the system beyond its limits.
Imagine you’re running a mass update process in Salesforce that reassigns leads to sales reps based on territory. To do this, you need to:
- Run a query to find thousands of leads that need mass territory reassignment.
- Update each lead’s territory field based on factors like geography, industry, and company size.
- Trigger additional workflows or automation, such as notifying the assigned rep or updating related account data.
If you don’t optimize how Salesforce handles these updates (by using techniques like bulkifying your code), Salesforce will process each record one at a time, which uses up system resources much faster.
Why it happens
Salesforce uses CPU time for every record it processes. Running bulk operations without using best practices — like batch processing, optimizing your triggers, or using asynchronous processing — quickly overwhelms the system.
Each record adds to the CPU load. Without strategies to reduce this load, Salesforce can’t process the updates within the allowed time. This is especially common for enterprise companies, which often handle massive data loads.
2. Complex operations on fewer records

Even if you’re only processing a small number of records, you can still run into CPU time limit errors when the operations involved are complex. When your code includes things like deep recursion, nested loops, or multiple SOQL queries, CPU time can quickly add up.
For example, imagine a lead routing process that checks whether a lead matches an existing contact or account. Typically, this process might:
- Run a SOQL query to match the lead’s email with an existing contact.
- Perform another query to check for a related account by comparing the lead’s email domain to account domains.
- Lastly, it might look for any existing opportunities to make sure the lead isn’t linked to an ongoing deal.
If the process includes recursive logic — where these steps are triggered again when the lead is updated or reassigned — CPU time can skyrocket, even when only a few records are being handled.
Why it happens
Hitting CPU time limits isn’t just about processing large volumes of records — it’s also about the your operation complexity.
Operations involving multiple steps, deep loops, or external system calls require more processing time for each record, which can push you over the CPU time limit. This makes code optimization crucial to preventing CPU time limit errors and maintaining optimal performance.
3. Unintentional trigger re-entry

Sometimes, triggers can unintentionally fire multiple times within the same transaction. This usually happens when one automated process — like a workflow rule or a Process Builder flow — updates a record, which then reactivates the original trigger, creating a loop.
Imagine you have a trigger set up to automatically update an account’s status based on changes to its related contacts. So, if a contact’s title changes to “Decision Maker,” the trigger updates the account status to “Active Opportunity.”
At the same time, there’s also a workflow or Process Builder flow that automatically updates the contact’s record when the account’s status changes. This creates an unintentional loop:
- The contact’s title changes, so the account status is updated.
- The account status update triggers the workflow to update the contact again.
- This re-triggers the original account status update trigger, and the cycle repeats.
This cycle can continue to loop, and each time the same records are updated within the same transaction, CPU time is consumed until Salesforce exceeds its limit and throws the error message.
Why it happens
Salesforce allows multiple automation tools — such as triggers, flows, and workflows — to act on the same records. When these automations trigger sequentially or recursively, they create cycles of operations that take longer to complete, ultimately exceeding the CPU time limit.
Adding safeguards in your code, like flags or static variables, can prevent triggers from running more than once per transaction. You can also optimize or combine automation to avoid unnecessary re-processing.
4. Excessive or unoptimized APEX code

When your Apex code isn’t optimized, it takes more time and resources to run than necessary. This is especially true when your code involves complex logic, inefficient queries, or when it handles large data sets.
Why it happens
Inefficient code slows down operations because every process takes longer to complete.
As your Salesforce environment grows and more complex processes are layered on top of each other, this issue worsens. Old, unoptimized code (legacy code) combined with increasing demands on the system can easily push your Salesforce org over the CPU limit.
Take Veracode’s lead management system, for example.
Its lead assignment system relied on between 800 and 900 rule criteria. As the organization scaled, the system became more complex, and the legacy code handling lead assignments started to cause problems. Each time a lead was processed, Salesforce had to evaluate hundreds of rules one by one, making the entire process slow and resource-intensive.
On top of that, the system wasn’t optimized for bulk processing.
Instead of handling multiple records efficiently, each rule was evaluated individually, using more CPU time than necessary. This led to frequent timeouts that interrupted operations and slowed Veracode’s speed-to-lead.
Veracode ditched CPU time limit errors and manual lead management with Traction Complete’s no-code, drag-and-drop platform.
By automating territory, account, and opportunity assignments in Salesforce, they reclaimed weeks of lost time and kept their sales engine running at full speed.
Read the Customer Story
Optimizing your APEX code is key to avoiding these timeouts. This can mean refactoring your code to handle records in bulk rather than individually, simplifying logic, or reducing the number of steps involved in a process.
But using no-code solutions like Complete Leads can eliminate the need for complex custom code altogether.
Tools like Complete Leads can help you handle large data volumes efficiently and reduce the risk of hitting CPU timeouts. By minimizing system strain and simplifying processes, they optimize performance and ensure your operations are scalable and responsive as your organization grows.
5. Managed Package interference

Managed packages from Salesforce AppExchange can sometimes contribute to CPU time limit issues.
These packages are built by third-party vendors and often include complex logic that you can’t directly modify or optimize. Since the code inside the package is externally developed, you don’t have much insight into how efficiently it runs, making it a “black box” for users.
Why it happens
While managed packages add valuable features to your Salesforce environment, they can also create performance issues if not optimized.
If the package processes large datasets or runs inefficient operations, it can quickly use up more CPU resources than expected, potentially pushing your org over the CPU limit.
Before installing a managed package, carefully review its performance documentation, user reviews, and support options to ensure it’s a reliable and efficient solution.
It’s also a good idea to monitor the package’s performance regularly within your org.
If you notice the package consuming too many resources, contact the vendor for help optimizing its use. Regular updates from the vendor can also resolve performance issues that contribute to timeouts.
5 Key Insights Ops Team Can Gather to Help Resolve CPU Timeout Errors
When a CPU timeout error happens, it’s common for RevOps, Sales Operations, (SOps), or Marketing Operations (MOps) to ask IT and Salesforce Admins to diagnose and fix the problem.
But CPU timeout errors aren’t just technical issues — they’re often tied to operational workflows and processes. Understanding the context of these errors can help Ops teams troubleshoot and provide critical information to speed up the fix.
Before reaching out to your technical team, consider gathering the following key insights:
1. Does the error usually happen during a batch process?
Batch processes — like mass data updates, automated cleanups, and territory reassignments — often deal with large volumes of records and can easily push Salesforce’s CPU limits. If the error occurs during these processes, it suggests your system is handling too many records at once, leading to a timeout.
Let’s say you’re running a scheduled batch process every night to update thousands of leads and reassign them based on territory.
If you start noticing CPU timeout errors the following morning, this could mean the batch process isn’t optimized. It might be processing too many records at once or using inefficient logic, requiring a restructuring of the process into smaller, more manageable chunks.
What to do
Work with your technical team to review and optimize batch jobs. Using asynchronous processing, like Batch Apex or Queueable Apex, can help Salesforce handle large datasets without hitting the CPU limit.
2. Is the error triggered by user actions within the Salesforce instance?
CPU timeout errors are sometimes caused by actions that users take directly within Salesforce — like manually updating records or triggering automation like Flows or Process Builder. Identifying if these manual actions are the source of the problem can help narrow down the investigation.
For example, a sales rep might manually update an account, which then triggers a series of automated processes like lead routing, updating related contacts, or sending notifications. If these workflows aren’t optimized or if too much automation triggers at once, the system might hit its CPU limit.
What to do
Monitor what actions users perform when the error occurs. If you notice certain workflows are involved, investigate whether they can be optimized by reducing the number of automation running simultaneously or simplifying the logic.
3. Does the error happen during large operations?
Larger operations, such as data migrations, territory realignments, or account merges, tend to push Salesforce’s CPU resources to the limit. If a timeout happens during these tasks, the operation might not be properly optimized for bulk processing.
For example, if your team recently completed a large territory reassignment involving hundreds of accounts and this led to CPU timeouts, it’s likely that the process wasn’t “bulkified.” This means Salesforce is processing each record individually instead of handling them in more efficient batches.
What to do
Review the bulk operations for large tasks and ensure that best practices like bulkifying triggers or using asynchronous processing are in place. This will help Salesforce manage these larger operations without exceeding CPU limits.
4. Have there been any recent changes to your Salesforce environment?
Installing new applications, adding managed packages, and updating existing automation can introduce performance issues. If you’re encountering errors shortly after a recent change, it’s worth investigating whether that change is responsible.
What to do
Review recent updates and installations to see if the problem started after a specific change. Work with the vendor of the managed package or your internal technical team to identify if it’s contributing to the CPU overload and whether you can make adjustments or optimizations.
5. Did you recently launch a new Salesforce flow or Process Builder?
Automations like Salesforce Flows or Process Builder can consume excessive system resources if they’re not designed efficiently. This is especially true when high-volume objects, like leads or accounts, trigger automation or when flows contain complex logic and multiple actions per record.
For example, if a Process Builder and a Trigger are both set to fire on the same object — such as when a lead is created or updated — both automations will run every time. Duplicated triggers can quickly lead to timeout errors, especially if multiple updates are happening simultaneously
What to do
Investigate any newly launched Flows or Process Builders and examine their structure. Look for ways to streamline their logic, reduce the number of actions they perform, or consolidate multiple automations into one.
For example, if Triggers and a Process Builder flow are acting on the same object, consider moving all the logic into a single Flow to avoid running both on every record update.
How to Avoid “APEX CPU Time Limit Exceeded” in Salesforce with No-Code Solutions
While understanding the root causes and gathering the right insights can help resolve issues in the short term, a more sustainable approach is preventing these errors from occurring in the first place.
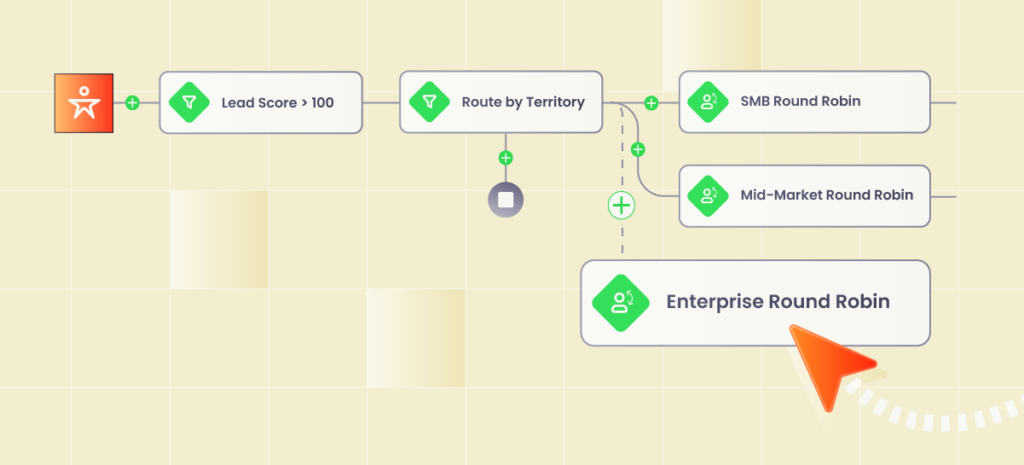
No-code solutions, like Complete Leads, let you do just that by simplifying and automating workflows without relying on complex custom APEX code. Our visual drag-and-drop user interface lets you easily build, adjust, and optimize your Salesforce processes — all without IT or Salesforce Admin intervention.

Plus, our tools run asynchronously in the background. They automatically fire off as many processes as necessary to complete the job, reducing the risk of hitting CPU time limits.

Don’t Let APEX Code Hold You Back
Apex CPU time limit errors don’t just slow down your operations — they disrupt sales, revenue, and growth. But with Traction Complete , you can eliminate these roadblocks with visual-first, no-code automation that works as hard as your team does.
Book a demo today and discover how how going no-code with Traction Complete can transform your workflow, empower your team, and help your business scale without system slowdowns.


